Faster Decisions with Data-Driven Design Insights
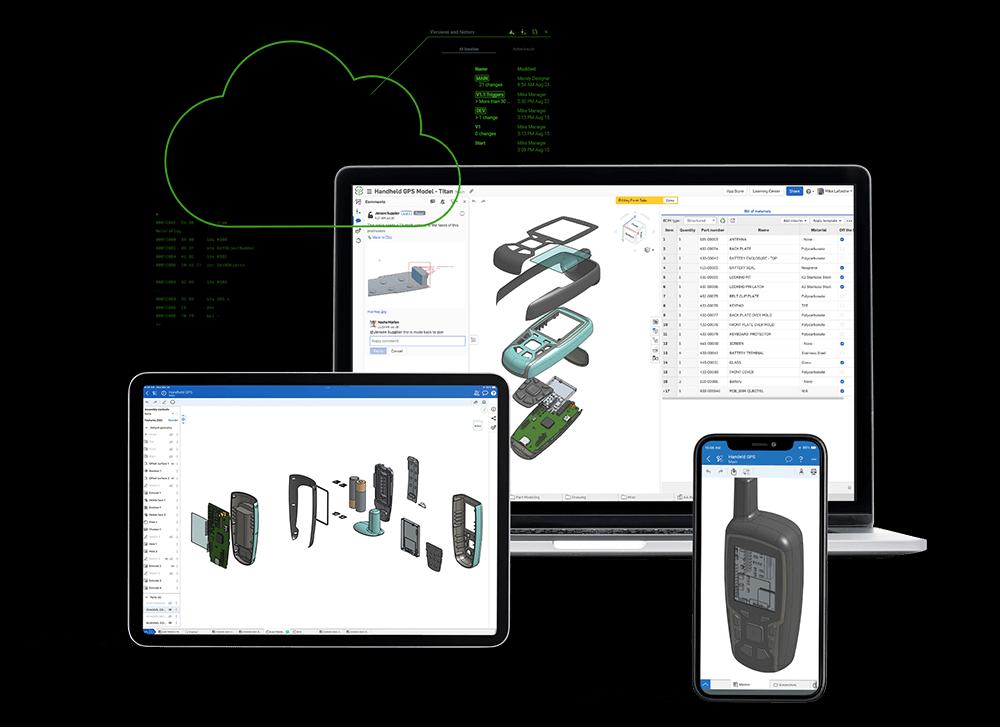
Onshape Enterprise tracks and visualizes all design activity, user access, and interactions to enhance project management and resource planning.
Onshape Enterprise tracks and visualizes all design activity, user access, and interactions to enhance project management and resource planning.
What is data-driven design?
Data-driven design uses insights from user behavior, performance metrics, collaboration analytics, and feedback to guide product development. By leveraging this data –like those found in Onshape Enterprise– teams can make informed decisions, optimize designs, and create solutions more effectively, improving product quality and reducing time-to-market.
Key Features
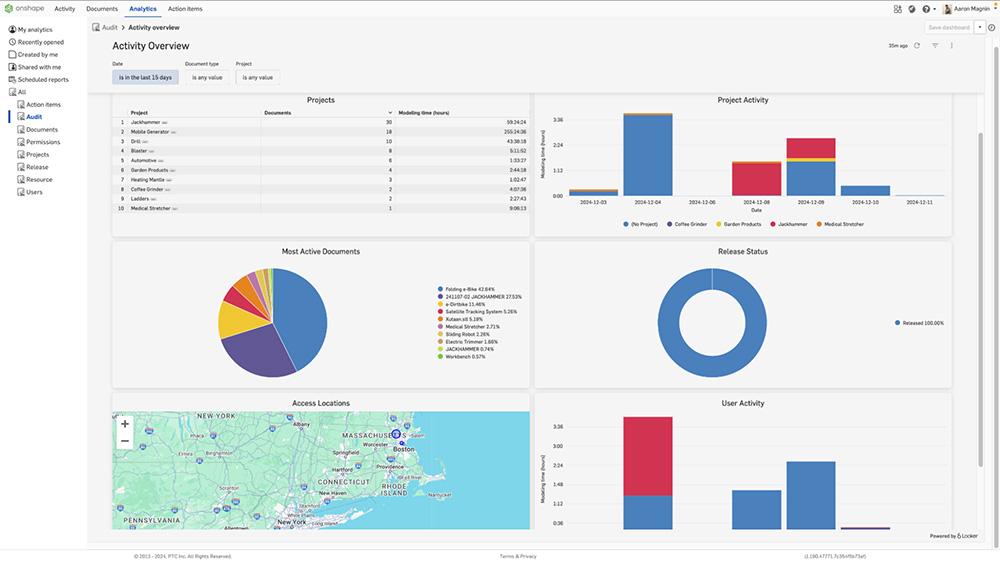
Activity Overview
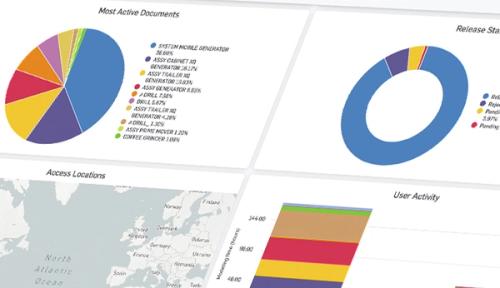
The Activity Overview dashboard offers a clear view of all your team’s design activities. Track hours spent per project, see who’s working on what, monitor pending release approvals, and identify top active Documents. Customize charts and tables for detailed insights to improve both project management and team efficiency.
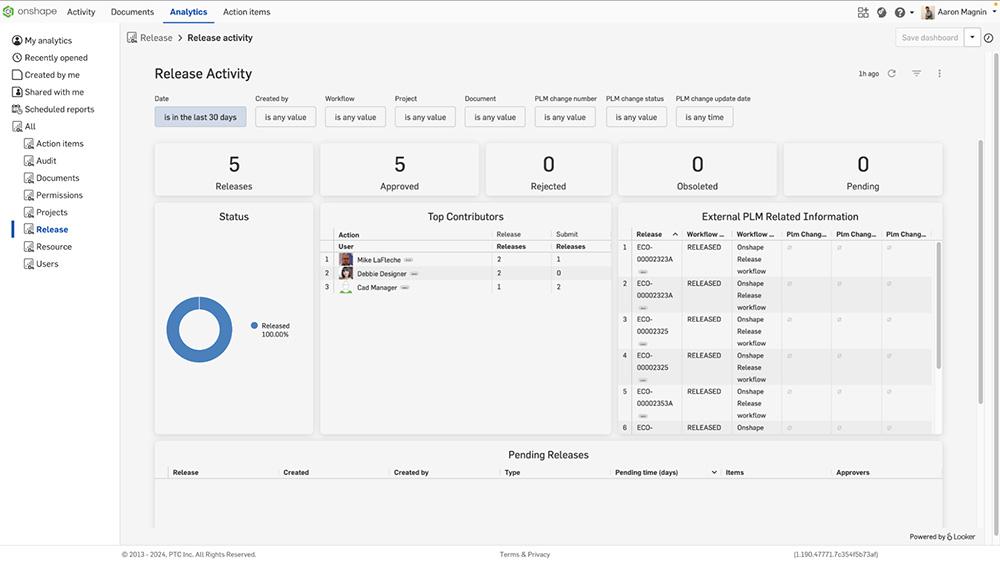
Release Dashboard
The Release Dashboard tracks all submitted Parts, Assemblies, Drawings, and data awaiting approval. View details like project ownership, submitters, approval status, and pending durations. Identify bottlenecks and streamline your approval process for better resource management.
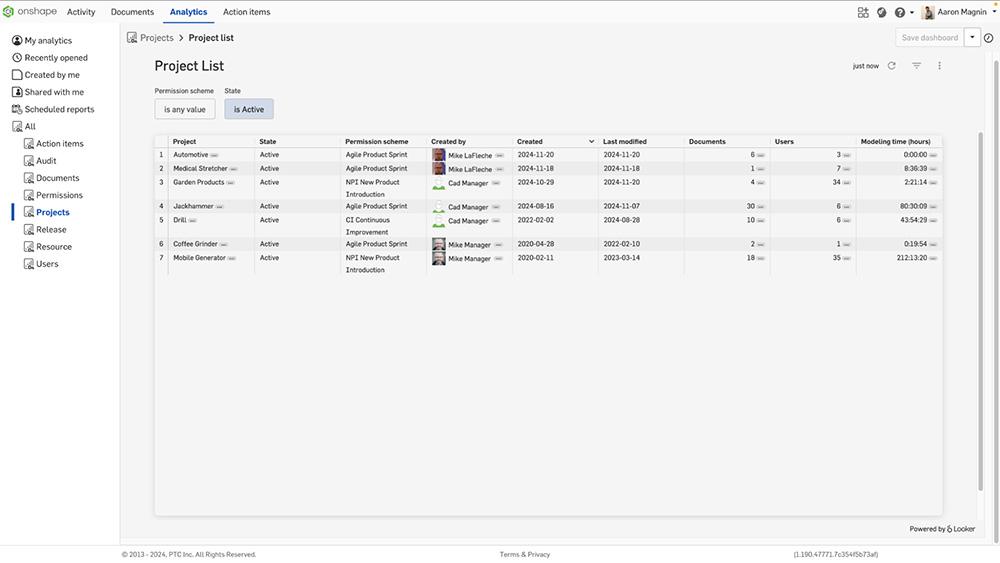
Project Dashboard
The Project Dashboard provides insights like modeling time, active users, and most edited Documents. Review permissions, roles, and feature activity to track progress. Stay proactive, identify issues early, and resolve them quickly to keep your projects on track.
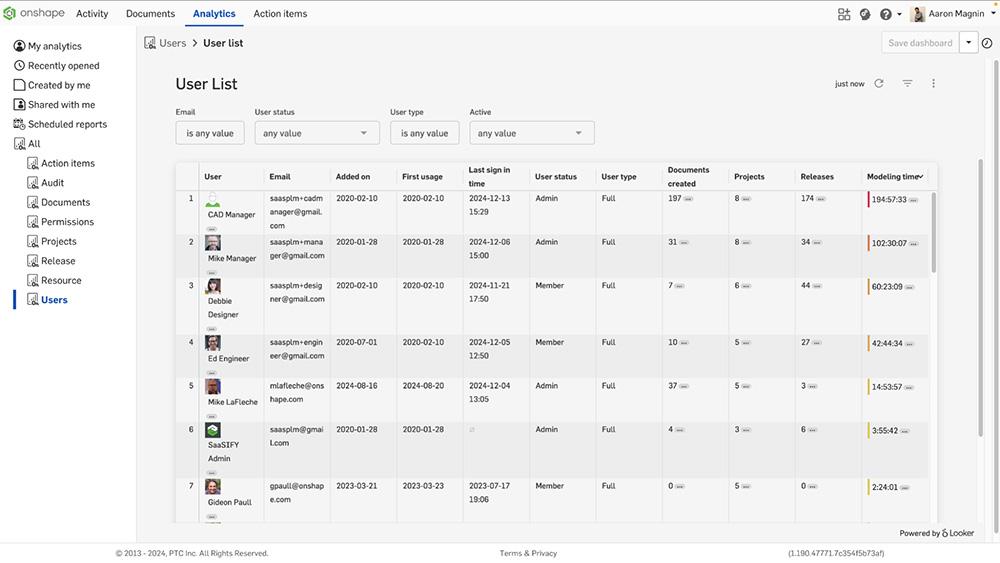
User Dashboard
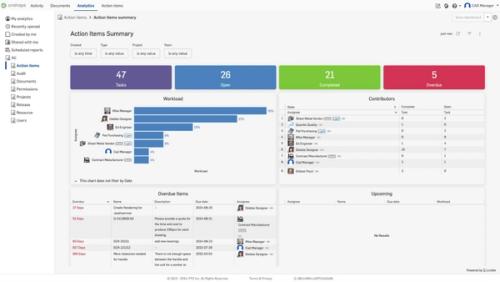
The User Dashboard tracks activity for individual users, including contractors and suppliers. See their projects, Documents, and time spent on design tasks. Easily review resource allocation to balance workloads and meet deadlines across your design teams.
Document Access
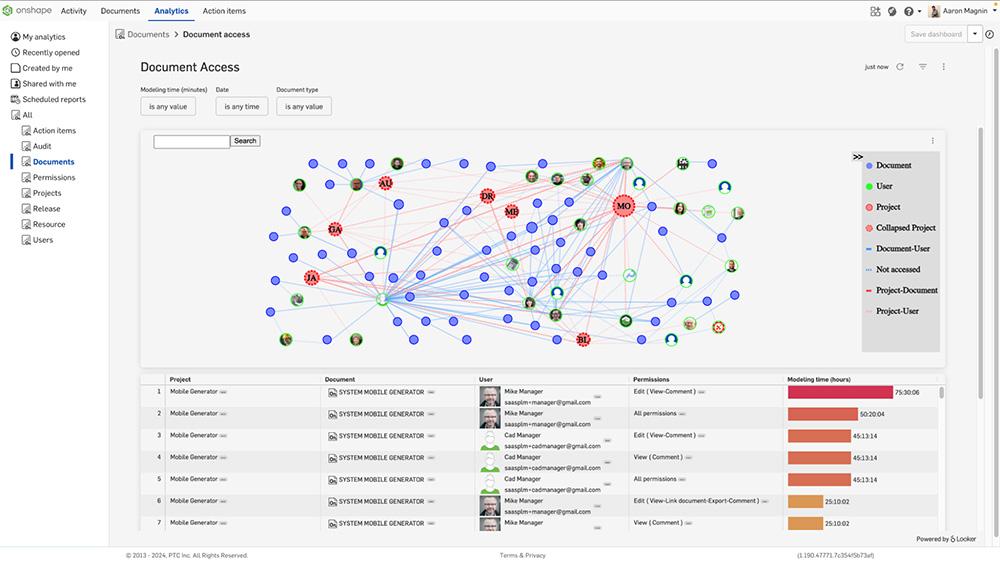
Easily review Document access and activity for security and audits with detailed, interactive graphs. Color-coded nodes link Projects, Documents, and Users. Click nodes or connections to explore modeling times, access permissions, and navigate your engineering data effortlessly.
Explore More
Learn how CAD analytics empowers data-driven product design by providing insights into team performance, design trends, and collaboration efficiency for better decision-making.
How Cloud Productivity Tools Enhance Product Development Collaboration
07.12.2024
Cloud-native productivity software is helping to break open the design black box, offering unprecedented transparency, and improving communication and tracking capabilities.
Read Blog
How Onshape Analytics Can Transform Product Development
07.16.2025
Dexcom transformed their engineering operations using real-time CAD analytics. Learn about the power of data analytics for mechanical engineering.
Read Blog
How Different CAD Personalities Shape Engineering Team Collaboration
08.05.2025
Research reveals four distinct CAD collaboration styles on engineering teams. Learn how manufacturing background influences design approaches and workflows.
Read Blog
How Engineering Leaders Drive Change with Onshape Enterprise Analytics
07.31.2025
Transform engineering productivity with Onshape’s integrated analytics tools. Get real-time design metrics, project dashboards, and team insights – no extra data visualization software needed.
Read Blog
From data to decisions: learn how in the Learning Center and Onshape Documentation
Talk to an Onshape Expert Today
With Onshape, your engineers and product designers get a secure, scalable, capability-rich product development platform delivered as a reliable service in a web browser.
Talk with the experts about bringing cloud-native CAD & PDM to your enterprise. Whether you've not yet begun your journey or started a year ago, we're here to answer your questions.
Bring the power of the cloud to your business.
