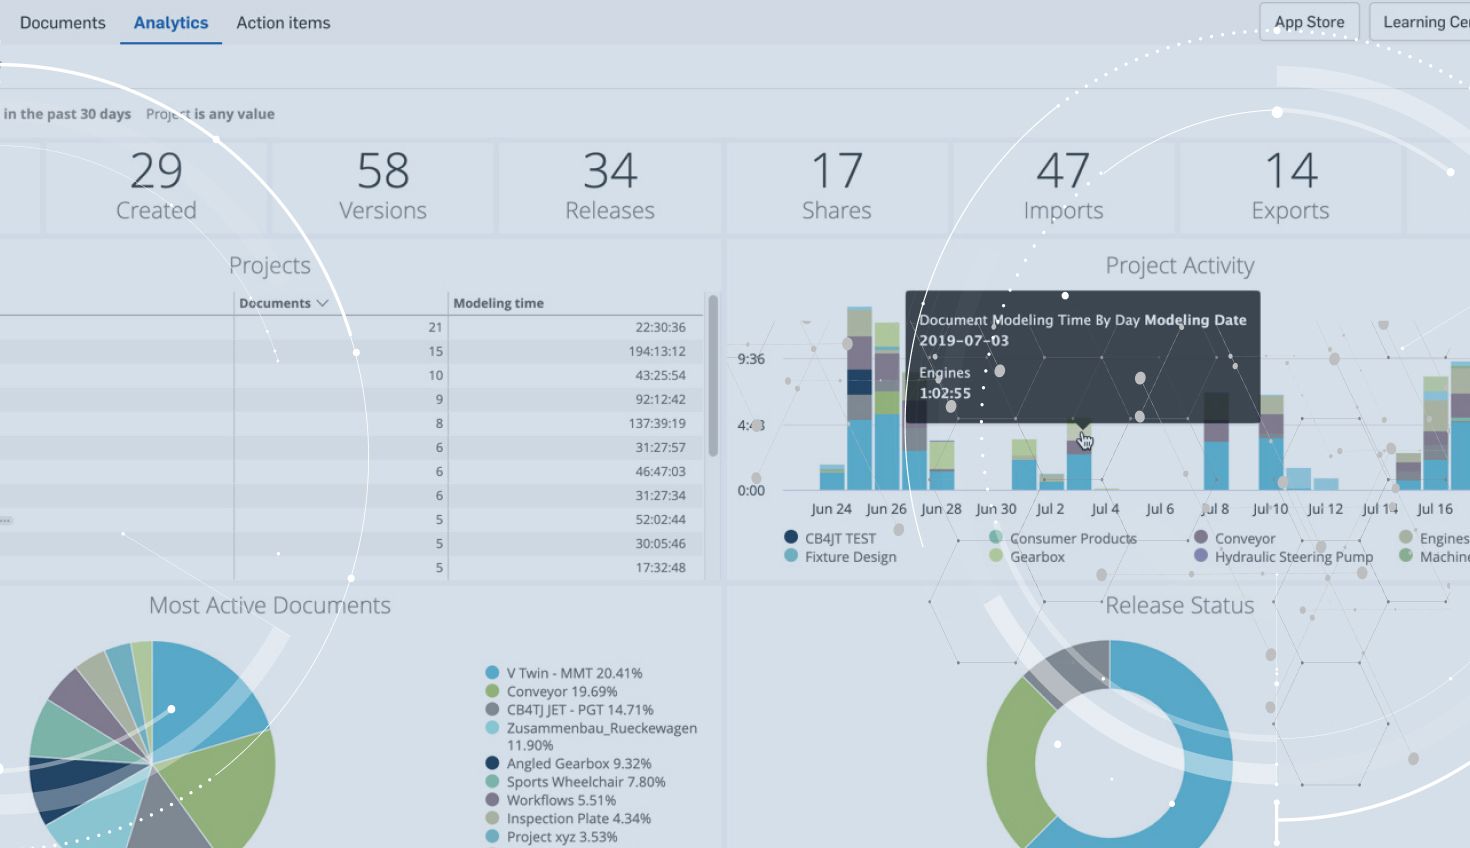
1:22
With the latest Onshape update, an improvement was added for Onshape Enterprise users that was highly requested. We are often asked, “Is it possible to customize and save analytics reports in Onshape Enterprise?” We are now excited to announce the answer is “Yes!” Let’s take a look.
To create your own Analytics dashboard, first open one of Onshape’s standard dashboards and customize it using the filters you see at the top. In the screenshot below, you can see we have edited the default filter to look back 30 days and only in a certain project.
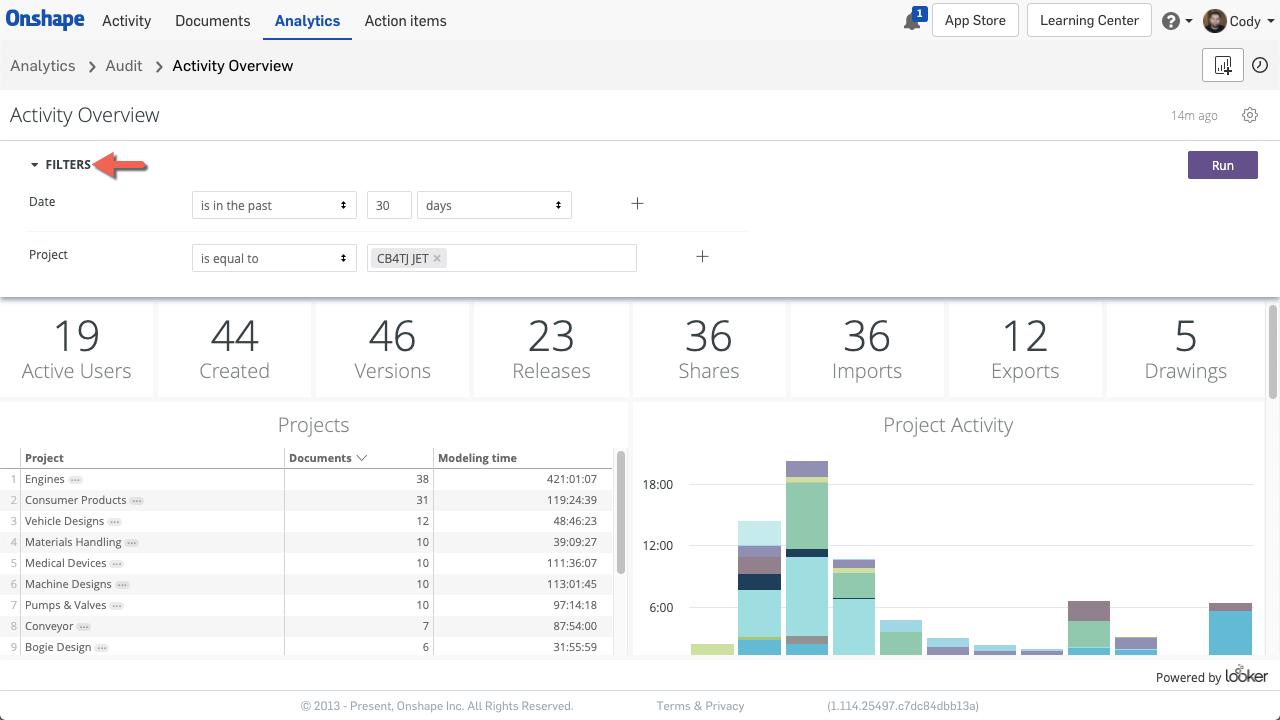
After you’ve set the filters you want, click “Run” and the dashboard will update to reflect the new filters.
So how do you save this dashboard and easily return to it later?
Simply click the “Add to My Analytics” button in the top right corner.
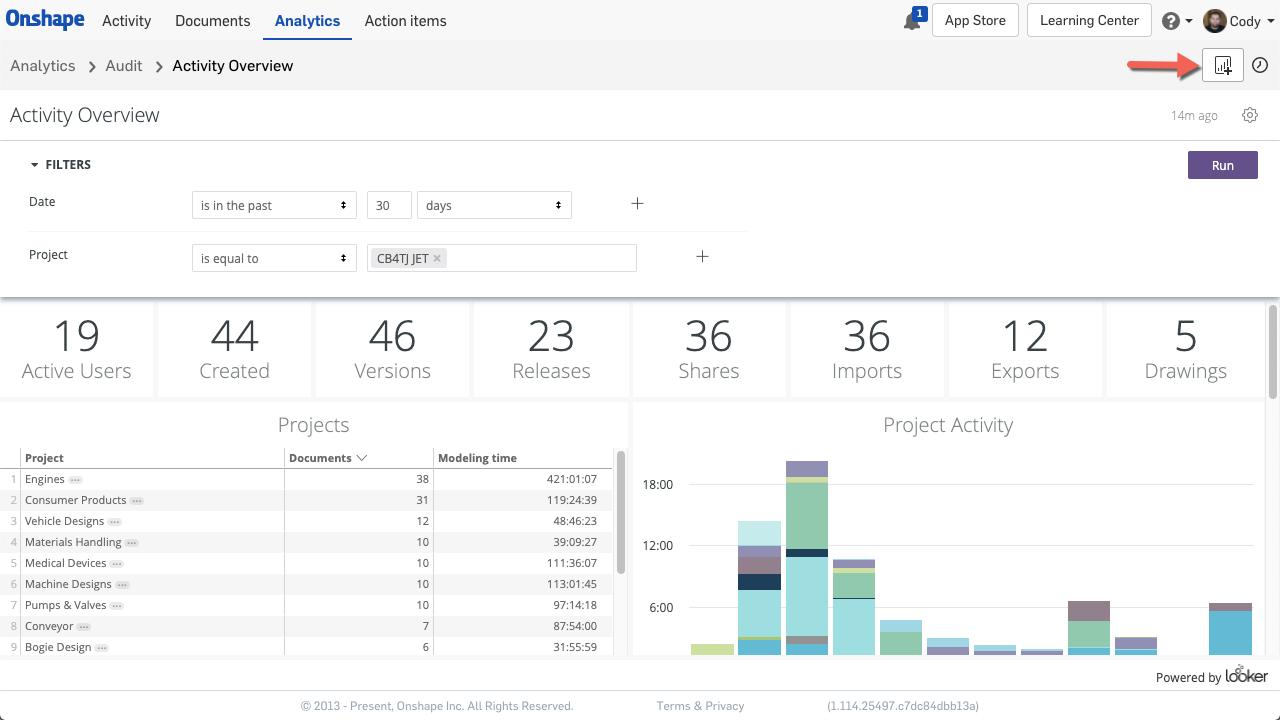
This will bring up the “Save Dashboard” dialog where you can type in a name and description for your dashboard.
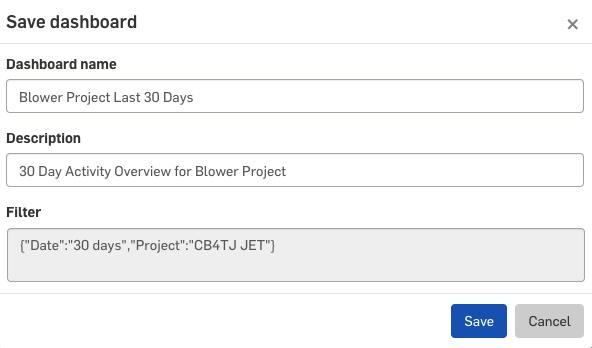
After clicking “Save,” your Dashboard favorite will be added to the “My Analytics” filter on the left-hand side of the Analytics page in Onshape.
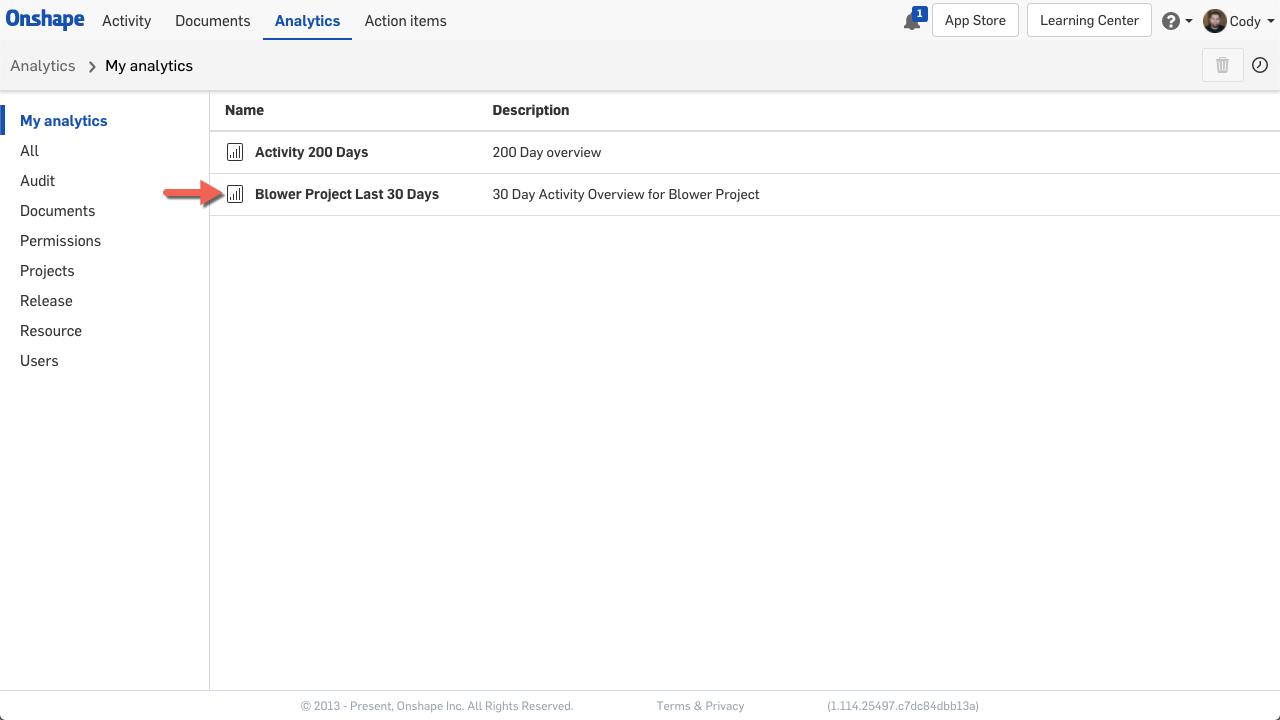
A few tips for working with Dashboard favorites:
- Dashboard favorites are available to anyone in your company that can see Analytics in Onshape. They are not specific to the person who created them.
- You can update an existing dashboard, by modifying the filters and clicking “Save” in the top-right corner.
- You can delete a dashboard by selecting it from the list and clicking on the trash icon in the top-right corner.
So that’s it! This new functionality allows you to quickly get to the information you are looking for.
Latest Content
- Blog
- Becoming an Expert
- Assemblies
- Simulation
Mastering Kinematics: A Deeper Dive into Onshape Assemblies, Mates, and Simulation
12.11.2025 learn more
- Blog
- Evaluating Onshape
- Learning Center
AI in CAD: How Onshape Makes Intelligence Part of Your Daily Workflow
12.10.2025 learn more
- Blog
- Evaluating Onshape
- Assemblies
- Drawings
- Features
- Parts
- Sketches
- Branching & Merging
- Release Management
- Documents
- Collaboration
Onshape Explained: 17 Features That Define Cloud-Native CAD
12.05.2025 learn more


